Friday, September 21, 2012

Weekly Inside Bar

Weekly Inside Bars are rare but they occur. And if history is any indication, we should see a dip early in the week and a reversal.

In the chart below, I highlight the last time this occurred with a green arrow (towards the left of the chart). Two similarities - the prior week's weekly bar had closed outside the Bollinger Band prior to the inside bar and the weekly Stochastics look very overbought.

Will history repeat? I think so but the market will tell ;-)

Tuesday, September 18, 2012

Thoughts on Tomorrow

I leave for tonight with one last post on the correction and implications of a Wolfe wave. Per my wave count, we finished an ABC move to the upside. I finally made more money than my broker did today!

In the chart below I present two wave counts. The blue count is asking for the tape to impulse down immediately towards the 127.2 or 161.8 fib targets identified below. The red count dictates the tape make another ABC move down to 61.8 retrace of this ABC move up and then move up to finish an ABC move of higher degree around 1461, the 61.8 retrace of the entire move down from the top. From there, an impulse move should get us to either 1448 or 1445 to setup a Wolfe wave.

Of course, the tape does not have to do either so we will just have to wait and see.


If we turn from either of the two targets marked 5?, we should have setup a Wolfe wave and then it is a matter of touching the red line.

Monday, September 17, 2012

Correction Finished?

Wow! Look at the chart below. Y is 127.2 Fib extension of W. We see a 5-3-5 retrace on ES. A zigzag!


The chart above is a correction of the chart I posted previously to accomodate the zigzag count.

Nothing is to say that we cannot have a double zigzag or even a triple zigzag so keep an eye out for the low of the day.

It would be fun if this becomes a double zigzag ending exactly at the 127.2 fib of the wave currently marked Y. That would set it up for another Wolfe wave and this one to the upside.

I have two spots for '2' of the Wolfe wave. One is marked 'A' in the chart and the other is 'C'. Both of them give the 127.2 fib extension at around 1448 on ES.

Wolfe Sighting

Missed this Wolfe in the morning. Got caught up in the chop today and my broker made more money than I did. Yeah, one of those days!

Don't go by the counts the chart. I am not sure the last leg down is correctly marked. It looks correct as an ABC move down but more likely, it is an impulse down as corroborated by the Fib extensions at 3 (161.8) and 5 (200) of 1 (marked A in the chart).

Saturday, September 15, 2012

Research: Fib Extensions

During my foray into the mysterious world of Elliot Wave Theory, I was introduced to the importance of Fibonacci numbers. Especially, the relationship between different waves. To my mind, 61.8 and its converse 38.2 were the most often found relationship. I was however applying these relationships to a wave and its retrace. I did not pay much attention to the fib relationships between waves going in the same direction. Not until I was exposed to Wolfe waves a month or so ago. Wolfe waves focus your attention on the Fib extension of the waves. Meaning, if a wave starting from 0, finishes at point A, say 1000, the next wave in the same direction would reach 127.2 or 161.8 extension i.e., 1272 or 1618, regardless of how much the prior wave retraced. This is great from a standpoint of knowing when the market will take a breather or retrace again.

I set about the weekly chart of SPX going back to early 90s to look for the more prolific extensions. Actually, when I started I had a hunch that 127.2 and 161.8 would be predominant but I wanted to back-test my hypothesis anyway.

So, here is what I found
1994-2000


2001-2008


2008-2012

Both the 161.8 and 127.2 Fib extensions do look very promising. Each time I had a 'hit', I put a blue colored ellipse next to it. As you look at the numbers, you realize -
1. Rarely do we get a retrace at the exact Fib number.
2. There is no way to know which one would apply. Is it 127.2 or 161.8 or both.

But here is the promising part-
1. More times than not, there is a breather or retrace at these Fib extensions. If nothing, these are great points to unload at the top and reload at the bottom of the weekly candle.
2. The price action plays a an important role here in differentiating a retrace from a breather.
3. On most occasions, a penetration of the 127.2 fib does not mean that it is not applicable. As a matter of fact, a penetration of that fib but close below it, adds to the importance of that Fib. Often, this is how you see the market taking a small breather.
4. When the fibs of the larger outer waves match the fibs of the inner waves, there is a larger potential of retrace.
5. Consecutive waves in the same direction display a larger degree of correlation. This may not be apparent when the waves are unfolding. But look for correlation between waves of higher or lower degrees.
6. The tape does not always 'touch' the fib extensions. This is especially true of the 161.8 fib extension. Many times, it is shy of the target by up to 10 points on SPX. So, becoming aware of the influence of 161.8 fib extension from 10 points earlier, especially when the length of the wave is long or of a high degree, helps.
7. I noticed that when 127.2 appears to be disregarded by the tape, it becomes a support. So, in cases where the tapes bursts through 127.2 and closes higher, more often than not, it comes back to use 127.2 as a support. A good help in knowing when to reload.

I will expand this list as I identify more items of interest from these charts. The takeaways for me remain the same - 127.2 and 161.8 are important Fib extensions and it pays to give attention to them.

Friday, September 14, 2012

Climax

What a finale to the saga! Ben will print $40 billion a month till the time he meets the objective of reducing unemployment or inflation goes out of control. Markets loved it. We went up 40 points into two days.

Any super bearish model of the markets is shot to dust. This market will be injected with $2 billion dollars every trading day that will be leveraged to the hilt and put to work in the stock market. Does not guarantee that we will never have dips (these banksters make money both on the way up and down). Algos will run wild. Only those who have access to infinite amount of money will control the tape and terms like fundamentals and investment will soon be lost. Follow the tape or you will go by the way of the dodo.

So far, I only had bearish models for the next year or so. Yesterday changed everything. Ending Diagonals turn into 1,2,1,2 moves with powerful 3 wave to the upside to follow.

We will get dips and every dip will be bought. As a matter of fact, many people I admire and follow predict a dip as early as next week. I concur. And I hope! As you know, I closed my long term positions in my 401K at around SPX 1380. I will be thankful, if I can get in at 1430. I explain later why.

Here is some research on what happened previously, from a technical perspective alone, when the market jumped this much. The week closed with the weekly SPX candle jumping and closing outside the Bollinger Band (14,2).

As recently as April of this year, we had a similar situation, NYMO closed outside its BB upper band for two days (April 26th and 27th) and SPX pierced the BB upper band too. Monday, April 30th,  brought a red candle but Tuesday, SPX set a higher high. This setup a nice little divergence with NYMO that started a very big correction.


Though the chart reflects the same pattern today, I don't think today's environment matches that of April. We are talking about $2 billion a day here injected into the market. Bring it on sellers!
As a matter of fact, every dip will be bought. I myself wait patiently for a decent dip to get back into the game. The low of this week's bar is about 1429 and is a good target for the coming week. I explain why.

But how much of a dip?
I did some 'research' yesterday. Just eyeballing the numbers. I looked for patterns on the weekly SPX chart where the weekly candle closed outside the upper Bollinger Band. Then I drew vertical lines at those candles. The green colored lines were where the following week continued to set a higher high and closed in green with close higher than previous week. These candles were found in early wave 3s. I found another set of candles which I marked with yellow vertical line where the next week brought a red candle and possibly a lower low but in the ballpark of the marked candle. These represent shallow retraces, say wave 4s, in a bullish wave 3 and are usually followed by further gains for multiple weeks after that. The third set has been marked with red vertical lines. These candles were immediately followed by sell-offs. They represented the end of the 5th wave. I see two samples that led to major retraces (100s of points on SPX). Here is the chart -


I am tending to believe we will see a wave 4 type of shallow dip. The next week's candle may be red. It may visit 1429 which was the low of this week's candle. It may even continue playing in this range of 1430 and 1475 for few more weeks frustrating all but the most nimble of traders before making a break for 1517 and above.

Why 1517 or so?

In my research on Wolfe waves, I found that relationships between waves in the same direction is more often 127.2 or 161.8 fib. I have a chart below that shows these numbers for 3 large waves to the upside. I don't think setting an all time high before the elections will be allowed :-) but 1517 looks plausible given that is 127.2 fib of the most recent wave to the upside.


Wednesday, September 12, 2012

Update 2: Potential EWT Count

Are we at the climax?

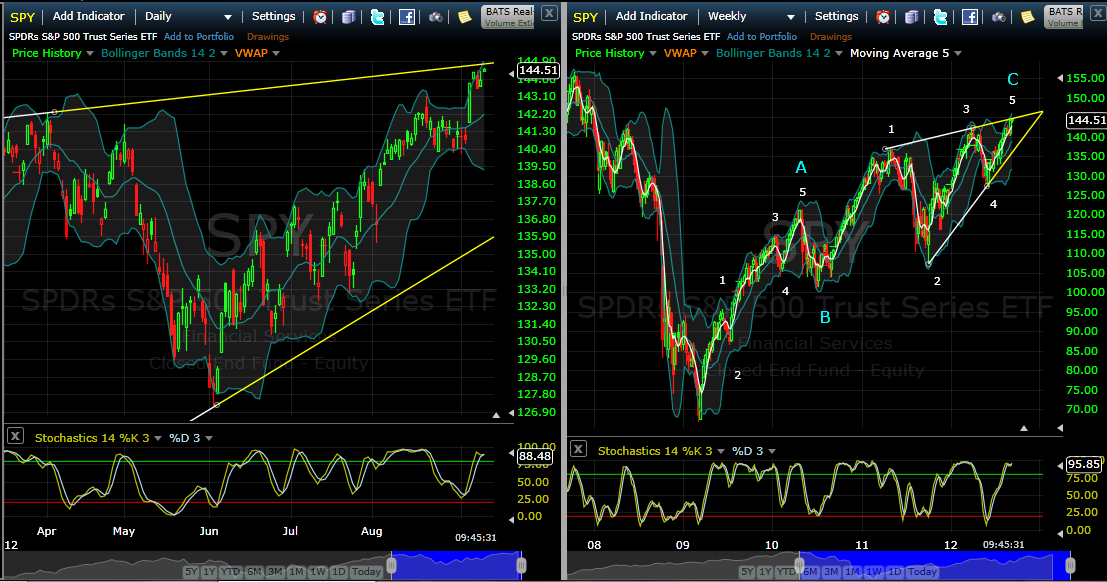
I present three charts below - the daily, weekly and monthly SPY. The tape has been playing out as I charted last month. The conditions were not ripe then for a top but are ripe now.

1. We are in the overbought range of the stoch on daily, weekly and monthly.
2. With divergence on daily and monthly to boot.
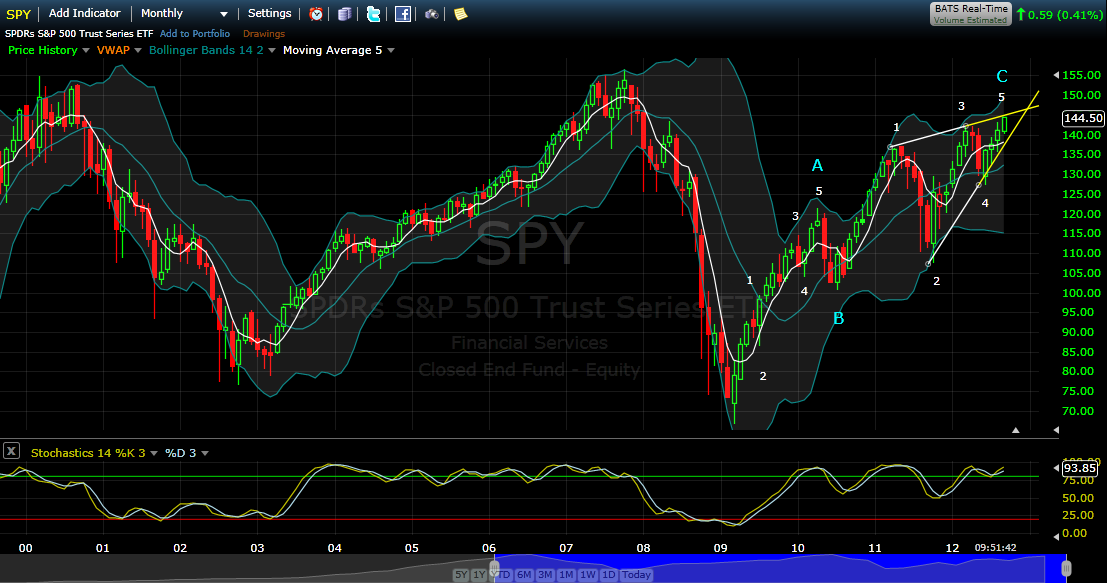
3. In EWT terms, we have completed a structure with good overall fib ratios.

We could stretch a bit more (that would be a good top) by about 20-30 points without breaking the bearish setup (88.6 fib retrace of the crash of 2007-9)

Of course, we could keep stretching up and set a new high and never look back :-) But here is a point to pause and think.

Where do we head from here? When bearish wedges break, they typically retrace to the place where they started. In this case 100 SPY would not be far fetched. A lot hinges on Fed and ECB printing more money. We should get that shot in the arm at around this number if Fed does not print right away.


Monday, September 10, 2012

Weekly Wolfe

Some technicals are pointing to a top having been put in already or very close to it. This would be a long term top.

First, is the Ending DIagnonal I have been tracking. We got a move to the downside today. Not a big move and most likely not from the 'top' for which I believe we have some room to the upside.

Second, a Wolfe wave on the weekly chart I have been tracking is shown on the chart below. For the fib ratios to be perfectly aligned, we should rally up to 146-7 on SPY. The last leg (marked 5) of the Wolfe Wave setup is very close to the 88.6 fib retrace of the 2007-9 downleg. When many technicals point to the same area, it should be heeded.


Sunday, September 9, 2012

Crucial stage

The market is at a very important stage right now. I have been following a bearish count since last month on SPY. As predicted, the market has reached the top of the Ending Diagonal. This is a multi-week chart and visible to many. The market will either reverse here, as expected, or surprise to the upside cancelling this count altogether.


The weekly stochastics are overbought and if we turn down on Monday and remain down the next week, we will setup a negative divergence on the week. But just because the signals are showing overbought does not mean the market will sell off immediately. There may be some chop this week.

Wednesday, September 5, 2012

Wolfe wave setup. Bearish

I see a Wolfe wave setup that finishes at around 1410. The fall is pretty steep from there. Keep an eye out!


EDIT 9/7: The setup never finished and we rallied post ECB meeting. As I write, we are at around 1437 on the futures.

Easy Trade: Bearish Divergence

Traders have to be nimble in this chopfest. An easy opportunity with higher chances in this bearish environment came up this morning.

Here was my tweet at the setup:

http://stocktwits.com/TradingJackal/message/9379524


 Then a few minutes and a few handles to the downside later

http://stocktwits.com/TradingJackal/message/9380227

Monday, September 3, 2012

Mega Wolfe

Now, I am no Wolfe wave expert. My knowledge of Wolfe waves is limited to what I found on investopedia. However, recently I have enjoyed some success with ES on very short time frames with this pattern. In an earlier post, I identified some Wolfe waves on daily SPX charts. Yes, the pattern appears on daily charts too!

So, next step was to apply it to the weekly charts. I mean candlesticks are candlesticks! To my surprise, I did not have to look too far. The bullish wave since 2009 seems to fit very well into a Wolfe wave pattern. It is not there yet but from what I have seen so far, it is close.

Wave 3 is 127 fib extension of wave 1 and wave 5 is very close to the 127 fib extension of wave 3. The 127 fib for wave 5 should be 1468.41. That is not too far off and I see no reason why it can't be achieved in a few weeks from now. This is also along the lines of the target I have in mind for SPX in the near future where I have us in the last leg to the upside.

If it does play out as expected and we get the move to the downside over the next year, the target could easily be the 61.8 retrace of the bull move to a little less than a 1000 (early 2013) or 78.6 retrace to mid 800s (mid 2014). That is pretty bearish. I don't know if this will play out as such. There is no pattern that is guaranteed to work and this one hasn't even finished setup yet! However, I will be keeping an eye on this one and post updates.


Good luck!

Daily and Weekly

It has been a while since I posted. I have been busy trading but had nothing exceptional to share. The tape has been volatile the past few days. For those with ability to play in such an environment, it must have been a great time. Not so much for me. Most of the calls I made during this time (very short term bullish calls) panned out but reversed course the moment I took the eyes off the tape. Sometimes, even when I had the eyes on the tape :-)

 So, what do the charts tell me?

On the daily ES, the Stochastics have crossed and turned up. Early yet, but in the past few years, this has been enough to get the BTFD crowd excited. I expect no different this time if the trend is still up. It is cruical time for ES. It cannot reverse course tomorow. Ideally, it should take out 1412 if its intent is to the upside and close above the Bollinger midline followed by another green candle. If it does not, especially, if it closes in red below the Bollinger mid line, it will setup a sell formation that would be trend changing.


Down below, I present weekly and daily charts on SPY and VIX. The weekly Stochastics is in the overbought area on SPY and in the oversold on VIX. The daily is the opposite. So, from a weekly perspective, if the price action turns bearish, it would be a good time to go short or at least sell the longs to the late comers. The daily should provide that opportunity if we cross the hurdles I mention above.

In the past few years, even when the weekly Stoch turned overbought, it did not bring about a selloff. As a matter of fact, the Stochastics spent most of the time in the upper region of the band. When it did reach the oversold line, buyers have stepped in and reaped rewards to the long side. If the trend continues to be long, weekly Stoch turning overbought may not be a reason alone to get off the long bandwagon. There has to be a follow through with price action.


On a short term basis (say this week), the following makes me favor the long side -
  1. NYSE McClellan Oscillator bullish divergence.
  2. VIX sell equity buy signal.
  3. Momentum indicators are bullish on ES now. Especially, the daily Stoch has crossed over and is now moving up. Trades to the upside are favored again.
  4. All indexes seem to be bearing an ABC correction (finished).
 On a long term basis, I am still keeping an eye out for that bearish price action.